Tuesday, May 17, 2016
Changes in the Exchange Rates
Appreciation and Depreciation
Exchange Rates Determinants
Exports and Imports
Friday, April 8, 2016
Financial Sector
Financial assets vs. Financial liabilities
Financial assets
.Stocks and bonds that provide expected future benefits
.Benefits the owner only if the issue of the asset meet certain obligations
Financial liabilities
.It is encouraged by the issuer of a financial asset to stand behind the issued asset
Interest rate-is the price paid for the use of a financial asset
Stocks- are Financial assets that represent ownership in a corporation
Bonds-are the promise to pay a certain amount of money plus interest in the future
What banks do
A bank is a financial intermediary
.Uses liquid assets to finance the Investments of Borrowers
.process is known as Financial reserve banking
.A system in which depository institutions hold liquid assets less than the amount of deposits
.Can take form of currency in Bank vaults Bank Reserves deposits held out the Federal Reserve
What banks do-basic accounting review
T account -Statements of assets and liabilities
Assets-item see how much a bank holds legal claim the uses of funds in Financial intermediaries
Time Value of Money
Time Value of Money
.Is a dollar today worth more than a dollar tommorow?
-YES
.Why?
-opportunity and inflation
- this is the reason for changing and paying interest
. Let V=future value of $
P=present value of money
R=real interest rate (nominal interest rate-inflation rate) expressed as a decimal
N=years
K=number of times interest is credited per year
Demand for money has an inverse relationship between nominal interest rates and the quantity of money demanded.
1. What happens to the quantity demanded money when interest rates increase?
Quantity demanded falls because individuals would prefer to have interest becoming assets instead of burrowed liabilities
2. What happens to the quantity demanded when interest rates decrease?
Quantity demanded increases. There is no incentive to convert cash into interests earning assets
3. Money demand shifters
1.Change in price level
Change in income
Change in taxation that affects investment
If the FED increases the money supply a temporary surplus of money will occur at 5% interest.
The Surplus will cause the interest rates to fall to 2%
How does this affect AD?
Increase money supply-decrease interest rates_increase investment- increase AD
Decreasing money supply-how does it affect AD?
Decrease money supply-decrease interest rate-decrease investment - decrease AD
Friday, March 4, 2016
Fiscal Policy
. Changes in the expenditures or tax revenues in the federal government-2 tools of fiscal policy
Taxes and Spending
Deficits, Surplus, and Debts
. Balanced Budget. Revenues = Expenditures
Deficit Revenue<Expenditures
Budget Surplus Revenues.Expenditures
.Government Debt
Sum of deficits- sum of expenditures
Government must burrow money when they are in a budget deficit
. Government burrows from
-individuals
-corporations
-financial institutes
-other governments or foreign leaders
Fiscal Policy Options
.Discretionary fiscal policy (action)Non-Discretionary fiscal policy (no action)
Expansionary Fiscal Policy
. combat recession
. increase government spending
.decrease taxes
Contractionary Fiscal Policy
.combat inflation
.decrease government spending
.increase taxes
AP Macroeconomics Consumption and Savings
Disposable Income ( Di)
.income after taxes or net income
.DI= gross income - taxes
2 choices
.with disposable income, households can either
-consume
-save
Consumption
.household spending
. the ability to consume is constrained by
-the amount of disposable income
- the propensity to save
. Do households consume if Di = 0?
-autonomous consumption
-dissaving
Saving
.household net saving
.the ability to save is constrained by
-the amount of disposable income
- the propensity to consume
.Do households save if Di=0?
-NO
APC and APS
APC- average propensity to consumeAPS- average propensity to save
APS+APC=1
Marginal Propensity to consume
. the fraction of any change in disposable income that is consumedMPC= C/DI
Marginal Propensity to Save
. the fraction of any change in disposable income that is savedMPS= S/DI
MPC+MPS=1
.only two options either to consume or to save
The spending multiplier effect
. An initial change in spending causes a larger change in aggregate spendingMultiplier= Change in AD/ Change in spending
Calculating the spending multiplier
Multiplier = 1/1-MPC or 1/MPS
.Multipliers are positive when there is an increase in spending and negative when there is a decrease
Calculating the Tax multiplier
When the government taxed, the multiplier work in reverse because money is leaving the circular flow
Tax multiplier = -MPC/1-MPC or -MPC/MPS
Notes on Investments and Investment Demand

Investments- Money spent on expenditures on-
-new plats (factories)
-capital equipment (machinery)
-New homes
-inventories (goods sold by producers)
Expected Rates of Return
How do businesses make these investment decisions?
-cost/benefit analysis
.How do business determine the benefits?
-expected rate of return
.How does business count the cost
-interest costs
.How does business determine the amount of investment they undertake?
-compare expected rate of return to interest cost
.if expected return> interest cost then invest and vice versa.
Real(r%) v. Nominal (i%)
. Nominal is the observational rate of interest. Real Real inflation is only known as an ex post facto thing.
Compute real interest rate; i%-m%
r% determines cost of investment decision
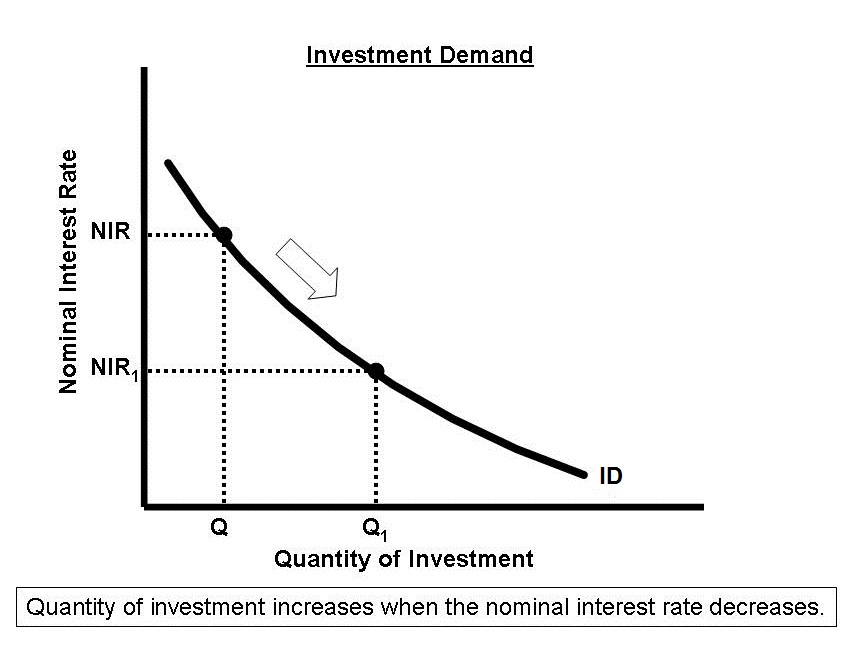
Investment Demand curve (ID)
Shape: Downward sloping
Why - When interest rates are higher fewer investments are profitable, when interest rates are low more investments are profitable.
Shifts in interest Demand (ID)
-Cost of production
lower costs causes shift to the right
Lower business taxes cause a shift to the right
New Technological changes cause a shift to the right
Low capital causes a shift to the right
Positive expectations cause a shift tot he right
and the opposite of all these cause a shift to the left.
Notes on SRAS
Nominal wages-it is the amount of money received by a worker per unit of time.
Real wages-it is the amount of goods and services a worker can purchase with their nominal wages. The purchasing power of your nominal wage
Sticky Wages-Nominal wage level is set according to an initial price level and it does not vary due to labor contracts or other restrictions.
Keynesian Range- Recession, Price is fixed, wages are fixed, the employment level is flexible, and output depends upon changes int he employment level.
Intermediate Range- Price is flexible, wages are fixed, employment level is flexible, and output depends upon changes in price level and employment level.
Classical Range- Inflation, Price is flexible, wages are flexible, employment level is fixed, output is independent in the changes of the price level.
Aggregate Demand Curve
AD= C+I+G+Xn
Why is Ad downward sloping?
1.Real interest rate effect
.higher price levels reduce the purchasing power of money
.this decreases the quantity of expenditures
.Lower price levels increase purchasing power, and increase expenditures
2.Interest rate effect
.When price level increases lenders need to change higher interest rates to get a REAL return on their loans
.Higher interest rates discourage consumer spending and business investment
3.Foreign Trade effect
.When the U.S. price level rises, foreign buyers purchase fewer U.S. goods and Americans buy more foreign goods.
.Exports fall and imports rise causing real GDP demanded to fall. (Xn decreases)
Shifts in Aggregate Demand
Shift in AD
.Two parts-a change in C, I,G,Xn
-a multiplier effect that produces a greater change than the actual change
An increase in Ad leads to a shift to the right
A Decrease in Ad leads to a shift to the left.
Determinants of AD
Consumption-consumer wealth-more wealth=more spending-consumer expectation Positive expectations=more spending
Household indebtedness less debt=more spending
- Taxes less=more spending
And vice versa
Gross Product domestic investment
-the real interest rate
. lower real interest rate = more investment
-expected returns
.Higher expected returns=more investment
.expected returns are influences by
.expectations of future
-technology
-Degree of excess capacity ( existing stock of capital)
-business taxes
Government spending
More Ad shifts to right
Less Ad shifts to Left
Net Xports
.Exchange Rates ( international value of $)
Strong dollar equals=more imp and fewer exports Ad shift to the left
Relative income
-More income= More exports AD shift to the right
NOTE: For all these AD shifts I am only giving one of the possibilities for each, the AD shift in the opposite direction means an opposite change in circumstances.
Tuesday, February 9, 2016
GDP Gap
GDP Gap- the amount by which actual GDP falls short of potential GDP.Okan's Law- for every 1% in which actual employment exceeds the natural rate of unemployemnt (NRU) a GDP Gap of about 2% occurs.
Rule of 70- is used to determine how many years it will take for a value to double given a paticular annual growth rate.
Unemployment
Now we look at the factors of unemployment and unemployment rate. Unemployment is the failure to use available resources, particularly labor to produce desired goods and services.Labor is defined as those above 16 years of age, and those that are also able and willing to work.
Those not in the labor force are those in military, mental institutions, jail or prisons, retired, students, and people not looking for a job.
Unemployment Rate: 4-5% full employment
Natural rate of unemployment = NRU
How to calculate
(# of unemployed / (# of employed + # of unemployed)) x 100 = unemployment rate
Types of unemployment
Frictional- searching for a job, temporarily unemployed, and have transferable skills.Structural- changes in the structure of the labor force, makes some skills obselete, and have no transferable skills.
Seasonal- due to time and nature of job
Siclicle- results from economic downturns, recession, laid off.
Now nominal GDP is the value of output produced in current prices. It can increase from year to year if either output or price increases. Real GDP is the value of output produced in constant base year price, it can increase year to year only if output increases.
Nominal GDP = Current year quantity x Current year price
Real GDP = Current year quantity x Base year price
From these it's possible to find a GDP deflator, it is a price index used to adjust from nominal to real GDP.
Deflator = (Nominal GDP x Real GDP) x 100
Now from the deflator we can calculate the inflation rate
Inflation Rate = (Deflator of current year- Deflator of old year) / Deflator of old year
Now there is also the consumer price index ( CPI), it is the most commonly used measurement of inflation.
(The price of the market basket of the current year/ the price of the market basket in the same year) x 100 = CPI
GDP
Now we move on to GDP, the total market value of all final goods and services produced in a country's border within a given year, and we also move on to the exciting set of calculations that come with it.
What's included in GDP?
C- personal consumption expenditures 65%
Ig- Gross private Domestic Investment 17%
- factory equipment maintenance
- factory equipment
- construction of houses
- unsold inventory of products built in a year
- Intermediate Goods- a good that required futher processing
- Used or Secondhand Goods- avoids double counting
- Purely Economic Transactions (Stocks & Bonds)
- Illegal Activity (Drugs)
- Unreported Business Activity (Tips)
- Transfer Payments
- Non-market Activity
Monday, January 25, 2016
Well let's first start off with what Elasticity of Demand is, Elasticity of Demand is a measure of how consumers will react to a change in price.
Something could have either an elastic demand, where E>1 and demand is very sensitive to a change in price, or an inelastic demand where E< 1 and the product is a necessity, or it could be unitary elastic where E=1.
To find the Price Elasticity Demand (PED) three steps must take place:
Step 1
(New Quantity- Old Quantity)/ Old Quantity= % change(delta ) in quantity demanded
Step 2
(New Price- Old Price)/ Old Price= % change ( delta) in price
Step 3
(%(delta) in quantity demanded/ %(delta) in price) = PED
Then you would use the PED to determine the thing's elasticity.
Opportunity Costs and Productions Possibilities Graph
Well first off let me start of by saying that Production Possibility Graphs have a lot to them but they actually aren't all that complicated. First let me start off by defining opportunity cost. Opportunity Cost is the next best alternative, so if you can't have the ideal, what's the next best thing?
A Production Possibilities Graph shows alternative ways to use an economies resources, but first 4 assumptions must be made: there are two goods, there are fixed resources, there is fixed technology, and full employment of resource.
Types of Efficiency
There are two types of efficiency, allocative efficiency, which is the products that are being produced are the ones most desired by society, and productive efficiency, which is products are being produced in the least costly way.
Nitty Gritty of Production Possibilities Graph
Efficiency is that we're using resources in such a way as to maximize the production of goods and services whilst under-utilization is using fewer resources than an economy is capable of using.
Introduction to Economics
Well first we have to start off with the two main types of economics which are macroeconomics,which is the study of the economy as a whole, and microeconomics, which is the study of specific units of the economy..
Macroeconomics consist of:
- supply and demand
- International Trade
- Minimum wage
- Market Structures
- Business Organizations